
For Road Safety Week 2021 we looked at some of the dangers faced by cyclists on York’s roads which we shared on social media during this week. We’ve collated findings here along with some interactive versions of the charts.
The first was the image at the head of this page which shows a stripe for every cyclist reported as a casualty on York’s roads during 2005-2020 – all 909 of them. An interactive version is below.
The colours of the stripes indicate whether the casualty was slightly injured (yellow), severely injured (red), or killed (black). Sections of white indicate periods without reports, most noticeably towards the right hand side of the graph which is the first lockdown.
Where Collisions Happen
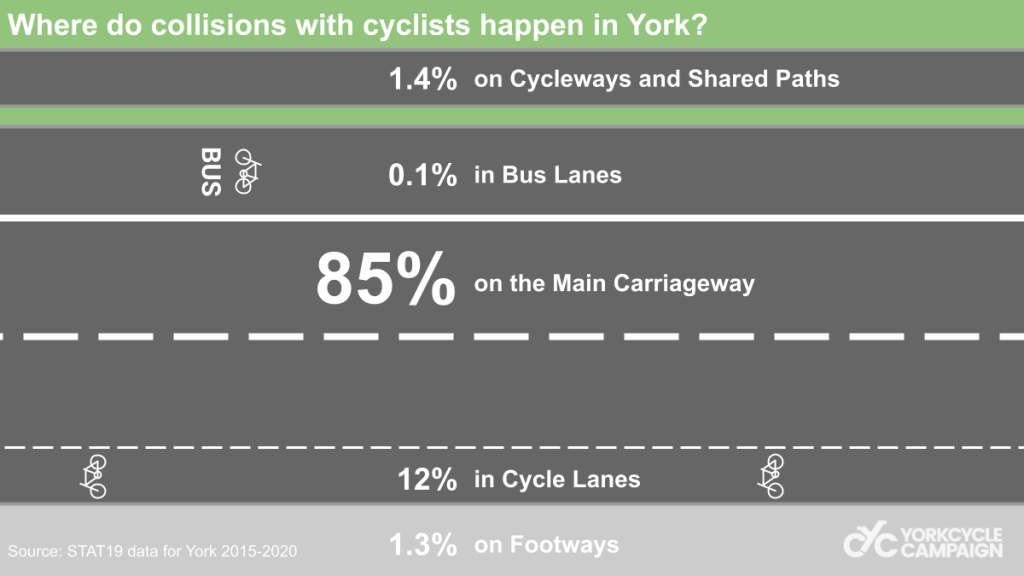
85% of collisions involving cyclists in York happened on the main carriageway amongst general traffic.
Cycle lanes see a reduction but we don’t have data to proportion this against the amount of cycle lanes in the the city. We can’t rule out if this is due to there being less cycle lanes than main carriageways. If you know how we can find this out please get in touch in the comments.
Danger Junction
We then looked at the types of junctions where collisions happen. By far uncontrolled ‘give-way’ junctions are are the most common location for collisions- almost twice as much as when there is not junction at all.
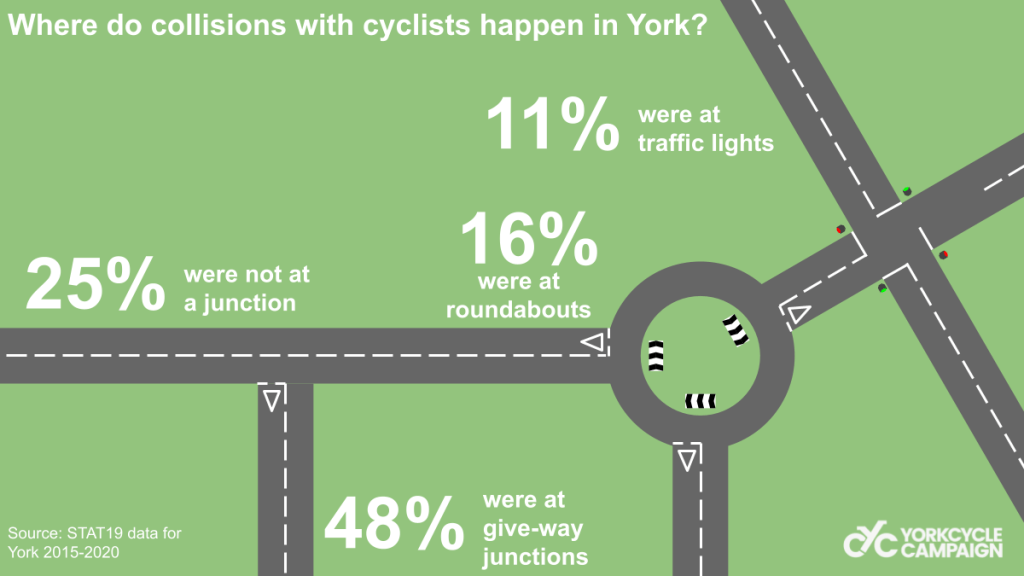
This raised a question about how many roundabouts and traffic lights there were in York. We were able to find out that there are 68 traffic lights around York according to York Open Data, but we don’t know how many roundabouts there are (again please comment if you know). By mapping the collisions we were able to work out that the collisions happen across 51 roundabouts and 55 sets of traffic light junctions. The give way collision locations are too many to count.
Give way?
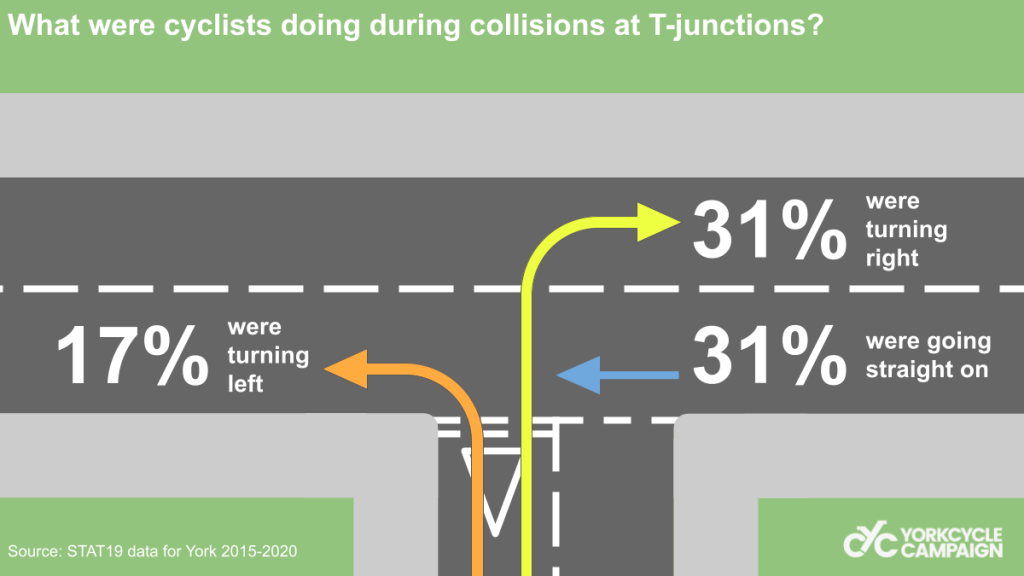
Looking bit deeper at T-junctions, the most common type of junction collision, we see that a significant amount happen when cyclists are turning right or going straight on.
We were reminded by one commenter to have a look at the work of West Midlands Police who ran an award winning campaign to protect vulnerable road users and their similar analysis of junction danger.
Potential Causes
Until this point we’d been looking at STAT19 data, which records the cold facts of the incident. To round off the week we looked at another source, RAS 50005, that gives the contributory causes to collisions by the police.
Lives Behind The Numbers
When studying statistics like these it can be easy to just see numbers and percentages, but behind them all are lives that have been affected, altered, and evenly cut tragically short. Remembering this then just one is too many, which is one of the reasons we campaign. Everyone should be able to travel around our city without fearing that at any moment their lives could be changed forever.
Could you help write more article like this?
The Campaign does so much good work and we want to share it with everyone; members and the public. If you can help us develop content for the website, newsletters, or social media we’d love to hear from you.
Whether you can help with writing up articles, editing videos, developing social media campaigns, or just gathering Insta worthy pics we’d love you to help give the campaign a louder and more diverse voice.

Leave a comment