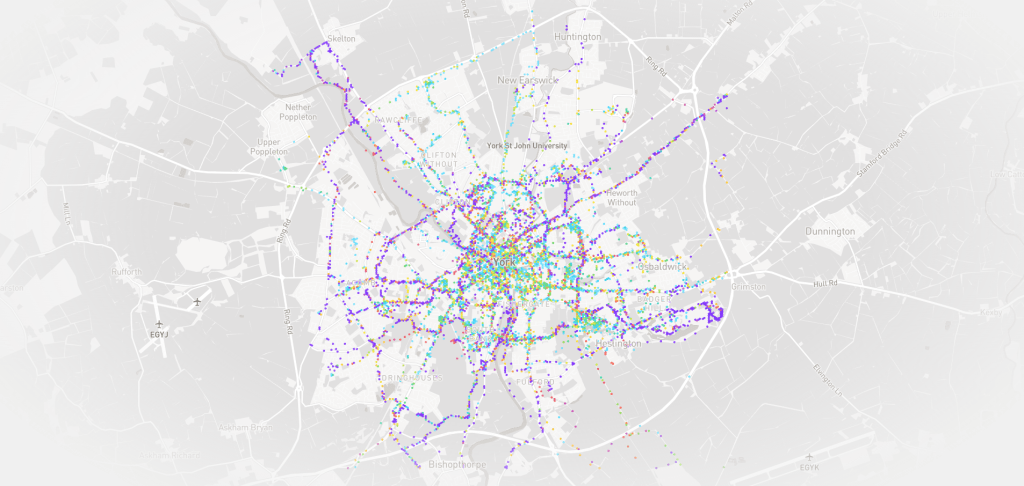
Caption: York Air Map Credit: Matthew Waudby
Dr Clare Nattress and Dr Daniel Bryant, University of York
In an era when air pollution is increasingly recognised as a pressing environmental and public health issue, the project York Air Map offers a distinctive, groundlevel perspective. It is an interactive mapping and educational platform designed to visualise patterns of air pollutant concentrations in York, with a particular emphasis on the real experiences of cyclists and everyday commuters. The website shows data collected through citizen science (ie with participation from members of the public), highlighting pollution hotspots and prompting conversations about air quality, mobility, and health.

York Air Map was launched out of a collaboration between artistresearcher Dr Clare Nattress and atmospheric scientist Dr Daniel Bryant of the University of York’s Wolfson Atmospheric Chemistry Laboratories. The idea began when Clare, back from a year-long world cycle trip, spent three months cycling around York collecting air pollution data using wearable sensors. Dan then analysed the results. The objective is to make ambient, groundlevel air quality visible, accessible, and meaningful, especially for those who negotiate towns and cities on foot or by bicycle.
The project complements fixed regulatory monitoring sites by mapping pollutant concentrations along streets and places where people are exposed. By presenting a streetlevel “airscape” it addresses questions such as: Which roads or junctions see the worst exposures? How does pollution vary across time, weather, space or traffic density? Where might interventions or route changes have most impact on people?
The website itself is intended not just as a data repository but as an educational tool for public awareness, engagement, and activism. It empowers cyclists, local community groups, urban planners, and policymakers to visually explore air quality data that is grounded in daily experience. Users can see spatial gradients, identify pollution “hotspots,” and compare different pollutant types across neighbourhoods.

York Air Map displays pollutant concentrations collected by mobile sensors (attached to bicycles) overlaid on a map of the city. The range of pollutants includes nitrogen dioxide (NO₂), Volatile Organic Compounds (VOCs), and particulate matter. The hardware used is the Plume Labs Flow 2 sensor, a compact, wearable airquality device that reports real-time concentrations. Data is transferred to a paired smartphone app over Bluetooth, then exported and visualised on the York
The map layers allow users to toggle between pollutant types, view data density, and zoom in on specific streets or sections of the city. Data can be categorised by levels (e.g. “Low,” “Medium,” “High”) to help non-experts interpret variation. Lower-cost sensors like the Flow 2 are not as accurate as high-precision regulatory monitors, so the map needs to be interpreted with appropriate caution.
Data is collected by citizen scientists who record their commute or frequently travelled routes, and multiple sensor traces are aggregated to build up a richer dataset. In one sub-project, data was collected from 16 citizen scientists, including members of York Cycle Campaign, yielding enough density to visualise pollution patterns across many streets of York. Once processed, the data is uploaded and displayed via the website for anyone to explore. The map’s value lies in its capacity to bring hidden pollution gradients into view, something that static, high-altitude monitors may not reveal.
The partnership between Dr Clare Nattress and Dr Daniel Bryant is at the heart of York Air Map. The collaboration is an unusual mix: Clare brings her artistic, performance background to the project whilst Dan contributes atmospheric chemistry analysis and scientific rigour. The project represents the intersection of art, science, activism, and infrastructure. Over the last four years, the collaboration has extended beyond the core duo. In 2023, the public launch of the map included an exhibition in York. This showcased not only the website but also artist books, olfactory filters, photographs, audio conversations, air-pollution “diaries,” and even the bicycles used in the experiment.
York Air Map demonstrates that collaboration between art-science and between professionals and the public can turn invisible data into tangible outputs. Clare and Dan have worked with over 50 citizen scientists so far and the collaboration continues to expand the network of sensors, refine calibration, explore patterns over time, and engage civic stakeholders. The platform encourages others to become citizen scientists, contributing their own sensor data and broadening the coverage of pollution mapping in York across different times and areas.
For more detail, visit the York Air Map website

Leave a comment